A new project is always a big undertaking.
There are so many moving parts in your average project. Employees being hired on or leaving for new positions. Project scope changing as things start moving. Delays in production or development. Operational inefficiencies leading to missed deadlines.
It’s never-ending. But great project managers can charge at each of these challenges, get things back on track, and keep things moving forward in as smoothly of a fashion as possible.
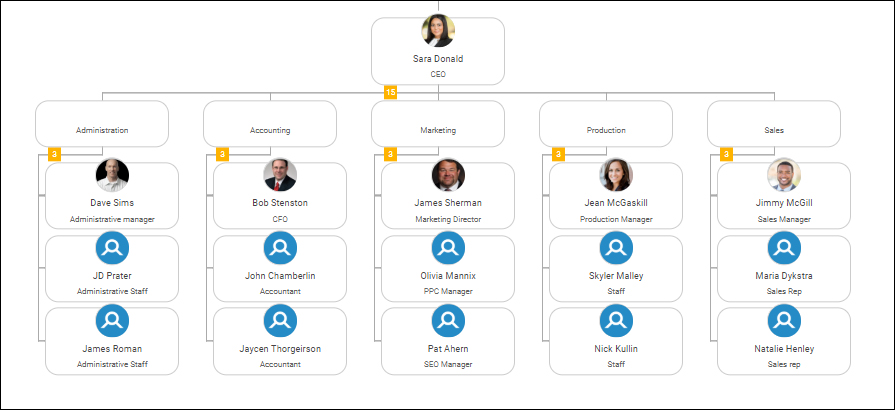
But how many project managers actually have a complete view of their project and everyone that is working in it? Many project managers fail to use project organization charts to help them with that visualization. A project organization chart is an excellent addition to other tools like your project management solution to help streamline several aspects of the project management process.
In this article, we’ll break down exactly how project organization charts can fit into your broader project management strategies. We’ll cover all of the benefits that they provide to project managers and the teams that they depend on.
Let’s get started.
#1) Gain a Better Understanding of Project Scope
Project scope often refers to the project itself — the requirements and tasks required to complete the project that your team is working on.
In this case, we use “scope” to refer to the internal resources that the project will demand. There is a big difference between reading that twenty-five people on your team are all working on a project and seeing the hierarchy laid out in front of you.
Well-run projects that come in on time and under budget have to make excellent use of the resources that are available to them. That means that project managers need to be keeping a close eye out for inefficiencies, gaps in their strategy, and improvements that can be made.
A project organization chart gives you a complete top-down view of your manpower and resources on any given project. You can see who is working on what aspects of the project and identify holes to fill to improve your productivity.
Although there are many tools for managing projects, project organization charts are a simple solution that provides a simple, visual way to see how your internal resources are being used on any given project.
#2) Project Organizatio
n Charts Improve Communication
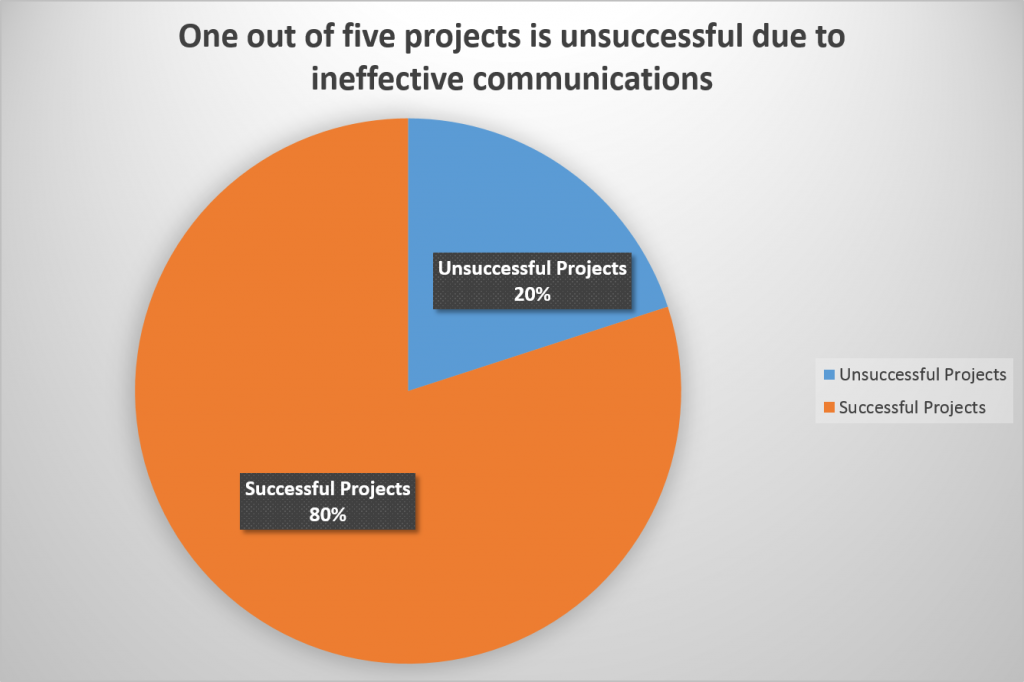
There is nothing more critical to project outcomes than communication. Being able to successfully communicate ideas to teammates and across teams will ultimately play a bigger role in the outcome of a given project than how skilled the team is itself. Even highly-skilled teams can communicate poorly and
A study from the Project Management Institute showed that one in five projects is unsuccessful due to poor communication alone:

Source: 2020 Project Management
There are many different types and channels of communication that take place during a project,
- Face to Face meetings
- One-on-one video conferences
- Group video conferences
- Telephone conferences
- Webinars
- Phone calls
- Stand up presentations
During each of these interactions, giving your team the tools they need to have a full understanding of who is playing what role in the project are critical for communication.
We’ve all been there. You’re working on a project, have critical information that you need to let someone on another team know, but you aren’t sure who the right person to contact is. You just don’t interface with them enough to know. So you send out a few emails and eventually, sometimes days later, get in touch with the right person.
That kind of back-and-forth kills productivity in a project. It’s important that you cut out as many communication middle-men as you can during any exchange, which is exactly what project organization charts provide.
#3) Streamline Workflows and Task Delegation
Project management tools are perfect for task delegation, but they don’t always provide the full picture. A common problem in any project is too many responsibilities falling on one person or team. One team might end up carrying a project while another has a relatively light workload.
A well-maintained project organization chart can help to alleviate these problems. With the birds-eye-view of your project, you can see exactly who is handling what aspects and spot where those task delegation errors might be taking place.
Being able to visualize the hierarchy of a project can help you to achieve balance. Both in workload and the pace at which different aspects of the project are being prioritized. Often, we are working from lists. Lists of team members in our project management solutions. Task lists. We rarely see try visualizations of how our internal resources are being used on a given project.
Use organization charts to improve how you assign and delegate tasks on your most critical projects, and you’ll have a more productive team overall.

#4) Assess Individual Workloads
In line with streamlining workflows and delegating tasks, the workload of individuals on a project may be hard to track at times.
Sure, you can go through your project management platform and see how many tasks are assigned to each individual person. That provides some insight, but it doesn’t really give you a complete view of the bottlenecks in your processes.
The top-down view that project organization charts give you a view of these bottlenecks. For instance, you might see that all graphic design requests are flowing through one specific person, despite the fact that there are dozens of requests in a given week.
Even if they aren’t producing the graphics themselves, they are still having to assess and approve these requests as they go through your pipeline. Using project organization charts, you’ll be able to spot this bottleneck and assign new resources to tasks that are keeping you from being as productive as possible.
#5) Project Resources Change Over Time
It is extremely rare that large projects do not see any turnover or changes throughout the course of the project. It’s just a reality of working in large-scale projects.
People will leave the company for new positions. Some people will be promoted and subsequently be assigned new work. Others may change jobs within the organization. Over time, these changes add up and can make it difficult to stay on top of your different teams.
To deal with this, you’ll need some help. First, you’ll want a complete picture of all of the people taking part in the project so that you can spot and fill gaps in your team over time.
One of the ways in which Organimi’s project organization charts help to deal with turnover and project changes is through our collaboration features. We make it easy for multiple members of a given project to regularly update the project organization chart. They can both edit the same chart, directly through our dashboard.
This means that you can break free from passing Google Docs or different versions of your organizational chart back and forth. You never have to worry about whether or not you have shared the right version. You’ll never have one single person being responsible for keeping the chart updated and falling behind as they focus on their other job duties.
Dealing with turnover is a serious problem in any large-scale project. Over time, it can derail a project and force you to miss deadlines or come in over budget.
#6) Improve Participation at Meetings & Retrospectives
We’ve already talked about the importance of team communication in projects. There is no doubt that it plays a critical role in the outcome of any project.
While project charts are excellent at facilitating one-on-one communication improvements, they also provide some benefits in group discussions as well. Group discussions and retrospectives are a key part of any successful project.
One of the biggest struggles of any project manager is improving participation in team meetings and stand-ups. When your teams are sharing their thoughts openly and feel secure giving their own opinions, it leads to more quality ideas flowing through your organization.
You can use your organizational chart to improve participation in these meetings. Not only do they quickly let you identify the best questions to ask (and who to ask) for each aspect of your project, but you can quickly cycle through the hierarchy of different segments of the project to facilitate as much feedback as possible.
Organimi provides a clean interface and printable copies of your project hierarchy that you can use to keep track of participation and feedback in meetings. Integrating your chart into your meetings will allow you to collect more feedback with a higher quality level. Then, you can use that feedback to improve your project execution.

#7) Keep Management In the Loop
It can be frustrating when management doesn’t have a complete understanding of what is going on inside of a project. They still want to be involved. They feel like they should be regularly checking up on things and staying involved — but they just aren’t there for the day-to-day interactions and as a result, they seem disconnected.
Project organizational charts are an excellent tool for management and C-suite execs as well. It provides them with a quick top-down view of all of the people that are involved in a given project and can help them to direct their questions and concerns to the right person.
Management that isn’t properly informed can be quite detrimental to projects. They can change focus, move resources around, or simply slow things down. Using charts not only allows them to contact the right people within the project, it provides a quick view of the scope of the project.
#8) Improve Post-Project Analysis
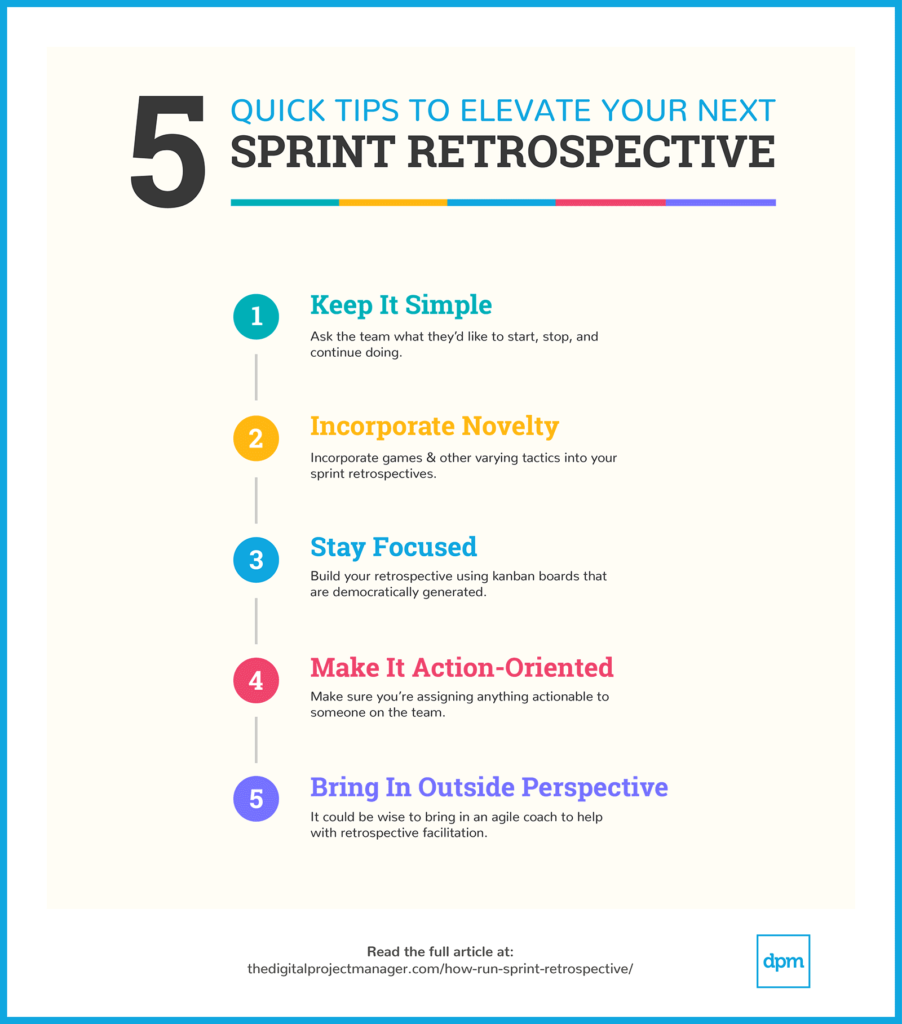
Whether or not your project as a success, the way that you evaluate the project will play a key role in the success of future projects. You always want to take time to hold effective retrospectives (which project organizational charts can be helpful for), but also properly analyze what went right and wrong in a project so that you can make the necessary changes to affect future projects.
Using a chart, you can see the hierarchy within each time while evaluating their performance. You can see who was involved, evaluate whether there were bottlenecks in your processes, and figure out where resources could have been diverted to streamline certain processes internally.
Post-project analysis reverberates throughout an organization and dictates how all future projects are undertaken.

Source: dpm
#9) Most Companies Don’t Provide Enough Internal Content
Companies today are so focused on the content that they are putting out there for their customers that they don’t stop and think about the kind of content that they are making available internally. In fact, many employees are lucky if their company as a whole produces useful content that helps them complete their jobs — let alone content that is specific to their teams or projects.
Organizational charts are a simple, low-cost piece of content that you can use throughout your organization. Continually creating updated and reliable internal documentation can improve the chances of project success. With a chart that shows the internal hierarchies and communication info of every member of a particular project, you put yourself in a position for success.
A Solution for Better Project Management
Project organization charts provide benefits throughout the completion of a project, from planning to post-project analysis. Giving your project managers a simple solution that they can use to view the hierarchy of individual teams that are a part of a given project, evaluate resources and how they are being used internally, and put themselves in a position for success is critical.
Organimi makes it simple to create effective project management charts. Our drag-and-drop solution and collaboration features ensure that you have a regularly updated org chart that you can use to run meetings, track resources, and improve your communication in all phases of the project.
Want to learn more? You can sign up for your free trial today and create your project organization chart.

