At Organimi we’re keen to get as much user feedback as we can.
We ask about the challenges you are facing in creating and using org charts when you create your accounts. And we appreciate the fact that so many of you provide it.
We encourage people to complete user surveys. Survey response rates are typically low, especially when there is no obvious “reward” for completing them. But we appreciate the fact that so many in the Organimi community do take the time to give us survey input. If you want, you can participate in our latest survey here.
Last, and by no means least, we appreciate the direct feedback people provide to our onboarding and client success teams on a daily basis as they work with Organimi.
The direct feedback we have received covers everything from complaints about features not working the way people expect (text formatting, photos not showing up, disappearing charts, and challenges printing charts) to positive comments about how Organimi is helping people do their jobs faster and easier, and suggestions for new features.
Please keep it all coming. As we always say, all feedback is good. It helps us make a better product that meets the needs of more members in the Organimi community.
Sharing User Feedback: Needs and Tools
With almost 3,000 organizations and 70,000 users onboard now, the Organimi community continues to grow. It has been a great few months. We’ve learned a lot and can pass some of that learning along.
We ask our users what the biggest challenges are in their organizations that they are using org charts to solve. The following are the most popular user responses:
- Defining org structures
- Clarifying roles and responsibilities
- Having the ability to dynamically update and keep their org charts current
- Onboarding and orienting new employees
This suggests to us that people are looking for something simpler, easier to use, and yet powerful to help them with their organizational design and team management and communication needs. These are important needs, and we’re glad people are looking to Organimi to help them address these needs.
Another question we often ask is “what org chart tools do you currently use to solve the challenges you are dealing with”.
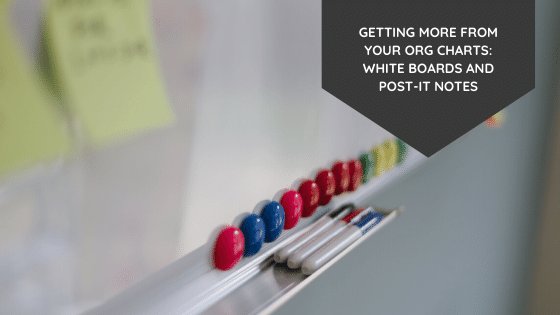
Most users indicate they are using a general purpose software application like PowerPoint, Excel, Word or Visio. A few have indicated “paper and a pencil”. In that vein, this month one client’s answer really stood out. In response to the question what do you use for org charts currently, they indicated “post it notes on a white board”. As it turns out, and as the below image found on Google confirms, this is in fact a “thing”. People do this.
Rocks & Sticks: Creating A Solid Foundation
I have a good friend who introduced me to an expression a number of years ago, that stuck with me and perfectly encapsulates this current state use what works approach to org charts, organizational design and transparency: “rocks and sticks”.
At the time, he was working for Siebel Systems, a major Silicon Valley technology company that was agressively marketing a complex and expensive to implement “customer relationship management” system. His work in the financial services vertical took him to some of North America’s largest banks and insurance companies. He couldn’t believe, he said at the time, what these organizations were using (sometimes paper based systems or at best Excel worksheets) to keep track of their valuable customer relationships. With youthful exuberance, he disparagingly commented on the “rocks and sticks” approaches being used by these long established brands to manage their important customer data.
At Organimi, we’re not so categorical. Rocks and sticks are the building blocks of many beautiful creations, after all.
Rocks also become stones and cement, over time and with processing. Sticks become the timbers and trim that hold, frame and beautify the stones as well. Lots can be done with rocks and sticks…..Fast forward several years, for example, and Siebel Systems has come and gone….swallowed up by Oracle after what were reputed to be complex and costly implementations with high failure rates. My friend still works in industry, using current generation technology to address the same customer data challenges organizations have grappled with for the past 20 years as data volumes have exploded. He has a more nuanced view about his ability to do that now, and a lot more respect for the workaround power of rocks and sticks.
Getting Started With Organimi
So, what should we say at Organimi to organizations using whiteboards and post-it notes to keep track of their teams and changes in their organizational structure. More importantly, what can we learn from them?
We don’t think “rocks and sticks” is the right label, for starters.
Whiteboards and post-it notes do work. They are simple. They are very reliable. They are easy to change and update. They can also come, as the photo above shows, in many colors.
We hope you find Organimi to be much the same way – simple, easy to learn and use, and reliable. If you don’t, please tell us. If we don’t pay attention, make lots of noise!!
Is a simple, easy to use tool for org charts good enough? Technologists always think their way is easier and better somehow. White boards are perfectly fine; so why change you might ask?
One of the challenges we see with white boards and post-it notes, for example, is that they are difficult to read, and even more difficult to share. It is not easy to drag a white board around from office to office. And what happens when the adhesive backing on all those post-it notes wears out? Software tools, used by the few to produce org charts for the many, suffer from many of the same limitations.
With Organimi you can create your org charts online, host them in the cloud, and share them with everyone you want to, for as long as you want. No more dragging around. Always up to date. No sticky messes. And a lot of the benefits of post-it notes built in as well. Even colour coding for your teams.
Awesome!
Sharing The Love (Of Org Charts)
At Organimi, we think re-imagining and re-implementing how users create, use and share org charts is more than enough to keep us busy. We can also help our clients support a whole host of other improvements and growth opportunities over the next 5 to 10 years if we do our job well. As we have discussed in other blogs these span many topics.
Organizations like McKinsey, Bain and BCG, as well as the major global accounting firms, consulting services and recruiting organizations and many others highlight these growth opportunities and related challenges for organizations with remarkable consistency these days: increasing focus on organizational transparency, driving innovation through employee engagement; increasingly widespread adoption of highly distributed and decentralized “virtual teams” with virtual team management issues across most knowledge worker based industries, labor scarcity becoming a more significant workplace challenge, requiring new avenues and methods to find, motivate and retain staff.
In all these areas, starting with a better foundation for organizational design and your team building efforts just makes a lot of sense. We think of that as our job and our mission: to help our users organize the information about the organizations they care about.
Need an example? In today’s blog we’re including an org chart of the BCG “brain trust” – its senior executive team and global practise managers. We created it using Organimi in a few minutes. The BCG Senior Management Team is below, and we have also showed how the org structure can be posted to share online with the team via Twitter, LinkedIn, Facebook, Google and Pinterest.
Definitely not rocks and sticks! Instead, a new era of information availability and organizational transparency. Who will embrace it? Where will they take it? That’s the great thing about users. They just decide, and we follow.
Thanks for reading. We hope you enjoy using Organimi, and keep the feedback coming. If you haven’t signed up yet, check it out here:
The Organimi Team

